How to use Google Analytics to get better web and marketing results

We are big fans of Google Analytics at Tiller because we’ve seen how much value it can drive for our customers (and our own business). But analytics tools can be daunting if you haven’t used them before. We often get asked questions like:
- What is Google Analytics and how can it help our marketing?
- What should I be measuring in my Google Analytics dashboard?
- How does Google Analytics fit into my martech stack?
- What do I do with all of this data?
Well, it’s answer time. Let’s explore what Google Analytics is and how you can use it to drive more traffic and conversions through your website.
What is Google Analytics and what can you do with it?
Google Analytics is a free web analytics tool that gives you insights into the who, the how, the what, and the so what of your website. It collects user data using a JavaScript code snippet added to each page on your website. Google uses this website data to generate custom reports on over 200 different metrics.
Metrics are captured within the four main categories on the Google Analytics dashboard:
Audience (the Who)
Learn who is visiting your website. Get analytics insights into visitor age, industry, job title, region, and more. Use this information to validate your ICP (ideal customer profile) and tailor your message to the right audience.
Acquisition (the How)
Learn how visitors are finding your website: organic search or paid ad campaigns? Use this information to understand which marketing efforts fuel your pipeline, and make data-driven decisions for resourcing and ad spend.
Behaviour (the What)
Learn what people are actually doing on your website. See which pages they visit, how long they stay on them, what page they typically exit from, and more. Use this information to identify opportunities for optimization and create user experiences that drive conversions.
Conversions (the So What)
Learn how many users are taking action on your website. Use this information to connect marketing to sales and see how website conversions translate into business revenue.
Who should use Google Analytics?
Google Analytics is ideal for any business that sees its website as a powerful tool for sales and marketing. It’s most often managed by a senior marketing role or by an agency partner.
At Tiller, we set up and manage Google Analytics for our customers and collect website data to inform optimizations. In an agency partnership, Google Analytics helps customers get maximum value from their website retainers. Instead of guessing at possible improvements, we use website data to identify specific opportunities for optimizations and analyze the impact of those changes.
What can (and should) you measure with Google Analytics?
With over 200 metrics at your fingertips, you can dive deep. But web analytics are only valuable when they’re actioned. In our experience, there are 12 key metrics B2B marketers should leverage on their website.
1. Users
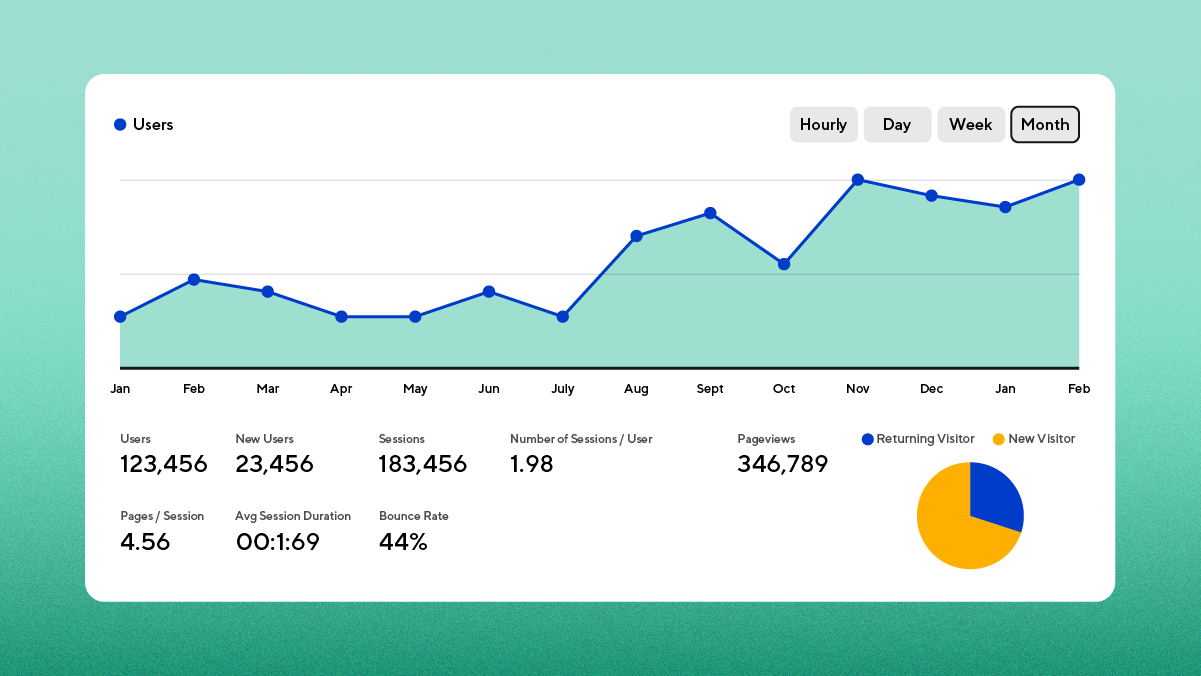
See how many unique or new visitors use your website. This metric helps you monitor website traffic ups and downs. Variation is normal, but if you notice a steady decline in users over time, it’s a good idea to dig into why.
2. Sessions
A session captures user activities that occur within a 30-minute window. If a user explores five pages of your website in 10 minutes, then exits, those activities are summarized in a single session. If they browse your website for 40-minutes, the session would end after 30 minutes. Session metrics are useful to understand user journeys and exit points.
3. Average session duration
Average session duration helps you understand how long users are spending on your website. This metric can give you insight into how relevant or engaging your content is.
Keep in mind that a short session duration doesn’t necessarily mean users don’t like your content. Look at the duration in the context of conversions. A user may come to your homepage, go straight to your Book Demo page, and submit the form. In this case, a short session duration might actually be a good thing. Always zoom out to see how metrics relate to each other.
4. Pages per session
Related to #2 and #3, this metric tells you how many pages a user views within a single session. This is useful to understand how much content users are consuming across your site.
5. Average page load time
Page load time measures the number of seconds it takes for a web page to load. Google Analytics displays the average load time across your entire site. A fast page load delivers a better user experience, but it also positively impacts SEO. The Google algorithm uses page load time as a factor when it ranks pages. So the faster your website, the better you rank on the SERP.
If you notice your average page load time is going down, check under the hood. Tools like SEMRush can audit your site and suggest changes that can improve site speed.
6. Ratio of new to returning visitors
New visitors are those that visit your website for the first time on a specific device. If a user visits your website on their phone for the first time, they are a new user. if they then visit your site using a different device (e.g. laptop), they are also considered a new user.
When users return to your website on the same device, cookies signal to Google that they’ve been here before. The ratio of new to returning visitors can help you understand how users progress through the sales funnel (e.g. returning again after doing more research). Keep in mind, there is a higher probability that a returning visitor will convert.
7. Bounce rate
A user bounces from your site when they only view a single page on your website before exiting. Your bounce rate is the percentage of visitors who only view one page. This metric can help you understand the effectiveness of your user journey.
A high bounce rate typically signals that page content needs to be more relevant and engaging. It can also indicate you need more internal linking on pages to encourage users to keep moving through your site.
8. Organic vs paid sessions
Visitors arrive at your website organically (browser search or URL entry) or through a paid ad. Google Analytics tracks these sessions differently, helping you see where your web traffic is coming from.
This is a powerful metric that empowers you to make data-driven decisions about resourcing and budget allocation.
Maybe you launched a new ad campaign and new visitors are pouring in. It could be valuable to increase your ad spend on that campaign to maximize results.
Or maybe you recently invested in content marketing and more users are finding your solution through organic search than through paid media. You might be better off dedicating more resources to content marketing and saving money on paid Google ads.
9. Average time on page
Google Analytics tracks the average time visitors spend on each page. This is a useful indicator for user engagement. The longer they stay, the more content they consume.
10. Pageviews
A page view is triggered whenever a page is loaded in a browser. It’s helpful to know what pages on your website are getting the most (and the least) views.
If you notice a page isn’t getting many page views, ask “why”. It could be that the content isn’t high-value to your ICP anymore and the page could be removed from your sitemap. It could also be an indicator that you need to include more keywords to drive organic traffic or increase the internal linking between pages to encourage flow between pages.
11. Goal completions
This is one of the ultimate metrics on Google Analytics. Goal completion tracking, also known as conversion tracking, indicates the number of times a sales-related action (e.g. submitting “Book Demo” or “Contact Us” forms) is completed.
Compare the number of goal completions on your website to Marketing Qualified Leads (MQLs) and Sales Qualified Leads (SQLs) to assess how your website is contributing to sales and ROI.
12. Events
In Google Analytics, an event is a behaviour. Just like with goal completions, you can tell Google exactly what behaviours you want to track.
For example, if you want to learn how many visitors are watching the product explainer video on your homepage, you can set it up as an event. When someone clicks the play button, Google Analytics tracks it.
How does Google Analytics fit into your martech stack?
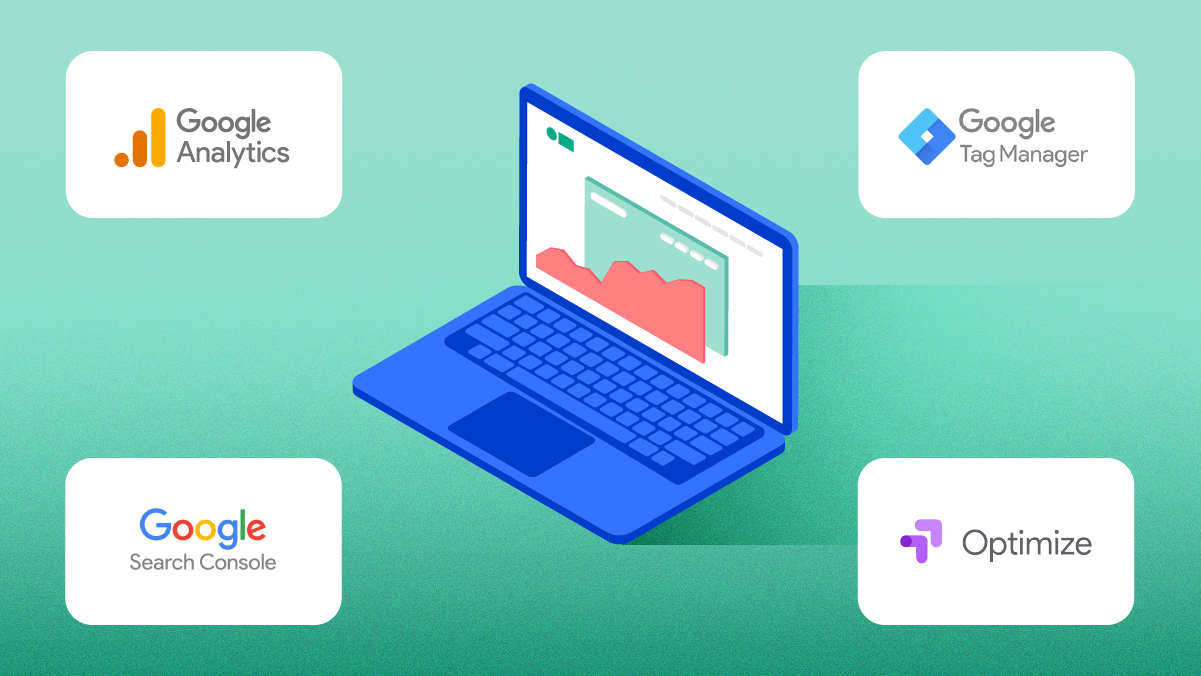
Google Analytics integrates with many valuable marketing tools. Google Tag Manager, Google Search Console, and Google Optimize all work in concert with Google Analytics to give you more insights into your website’s performance, all within the Google Analytics dashboard.
Google Tag Manager
Integrate Google Analytics with Google Tag Manager (GTM) to simplify event tracking on your website. Instead of asking a developer to add Google Analytics tracking code snippets to your pages, just copy and paste the code into Google Tag Manager and specify which pages you want it added to.
Google Search Console
Integrate Google Analytics with Google Search Console to see how your website is performing in browser searches and learn what keywords website visitors are typing in to find you. Google Search Console also helps you identify and fix SEO errors (e.g. crawl issues, 404 errors, etc.).
Google Optimize
Integrate Google Optimize with Google Analytics to run A/B testing and multivariate testing and validate hypotheses for improvement. Test results are all displayed within your Google Analytics dashboard so you can easily flip between various metrics.
What should you do with your Google Analytics data?
The biggest question of all. Google Analytics puts an enormous amount of data at your fingertips. You can see line graphs and bar charts galore, but it’s only valuable if you ask another question:
Why?
Why did your organic web traffic go up? Why is your bounce rate high? Why, why, why.
Google Analytics points you in the right direction so you can begin testing and experimenting (Google Optimize is our testing tool of choice). Armed with the right data you can test headlines against each other, change the colour of your CTA buttons, and much much more.
At Tiller, we help you set up Google Analytics (including custom event and goal tracking), monitor and analyze metrics, create and test hypotheses, and optimize your website for conversions.
Collecting the data is the first step. Actioning the data is where the real magic happens.
Recap: 4 reasons to make friends with Google Analytics
- It shows you what’s working and what isn’t working on your website
- It integrates with other powerful web tools in one analytics dashboard
- It empowers you to make data-driven decisions on marketing spend
- It identifies opportunities to optimize for conversions


